
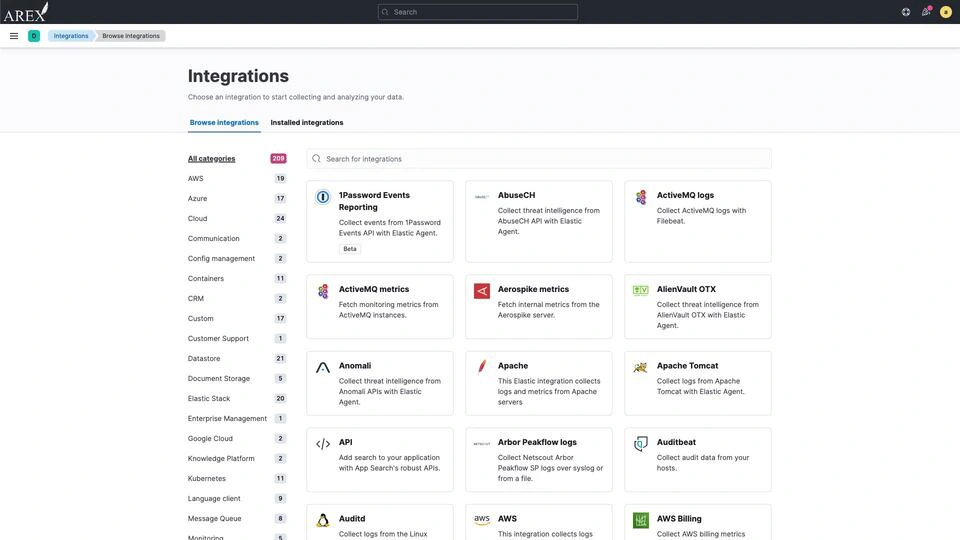
Seamlessly monitor your infrastructure with support for 200+ integrations, including cloud platforms such as AWS, Microsoft Azure, and Google Cloud. Efficiently store logs and metrics at high cardinality for faster troubleshooting with intuitive visualization and quick analysis supported by out of box machine learning and preconfigured dashboards.
Simplify infrastructure monitoring at scale
Unified Arex Agent with centralized management (Fleet) simplifies the collection and management of logs, metrics, and all other monitoring data. Deploy agents, update agent configurations, and add integrations for new data sources with a single click.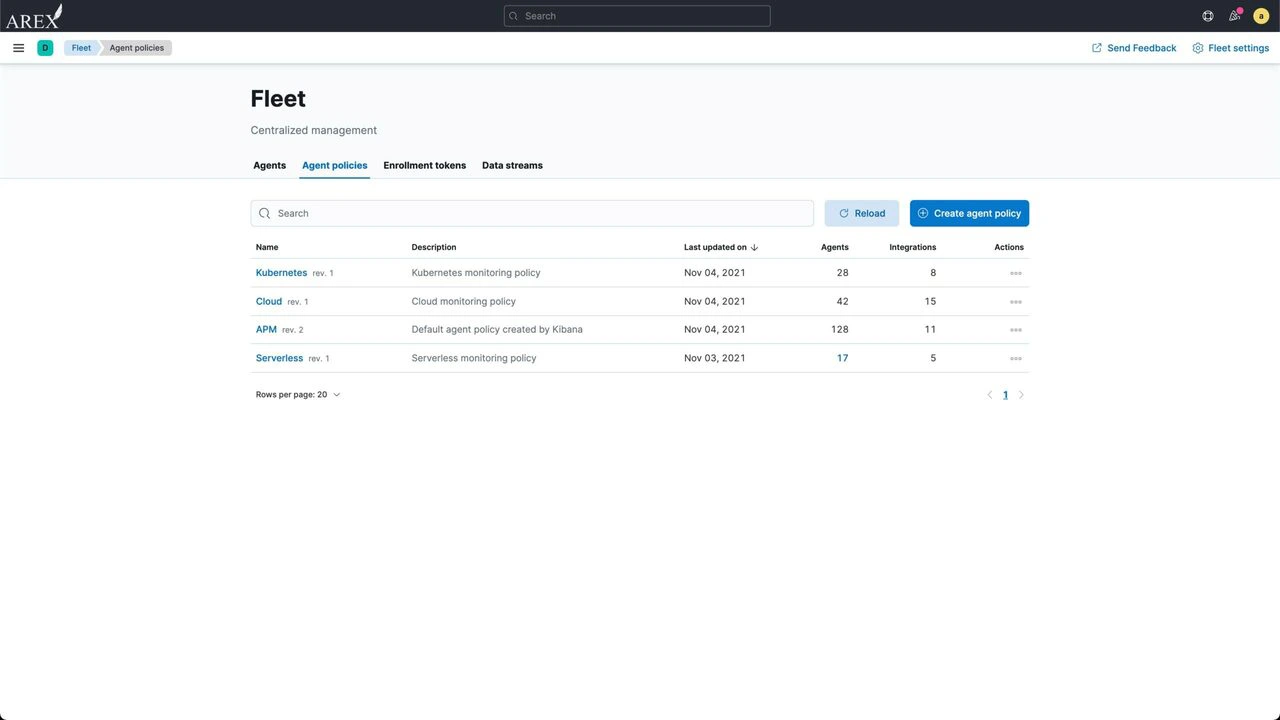
Unparalleled visibility into all your infrastructure performance
Built on powerful Arexsearch, stream in and scale infrastructure metrics from your systems, cloud, network, and other infrastructure sources like AWS, Azure, GCP, Kafka, and NGINX through native Elastic integrations or common data shippers like Fluentd. Unify your infrastructure metrics from Prometheus with your logs, traces and end user monitoring data for complete end-to-end visibility.Pinpoint full-stack problems with advanced visualizations
Get logical and physical views of your infrastructure topology. Analyze current and historical performance trends for each infrastructure component with logs, processes, application performance, anomalies and metadata in context.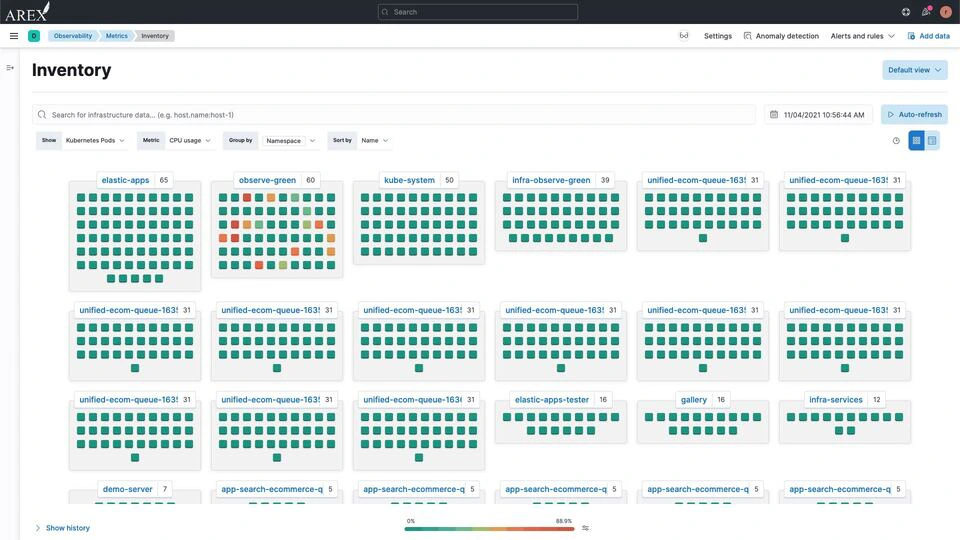
Our customers bring search to life
From startups to the global 2000, Arex powers search solutions for thousands of companies worldwide to find documents, monitor infrastructure, protect against security threats, and more.


Find the 'unknown unknowns'
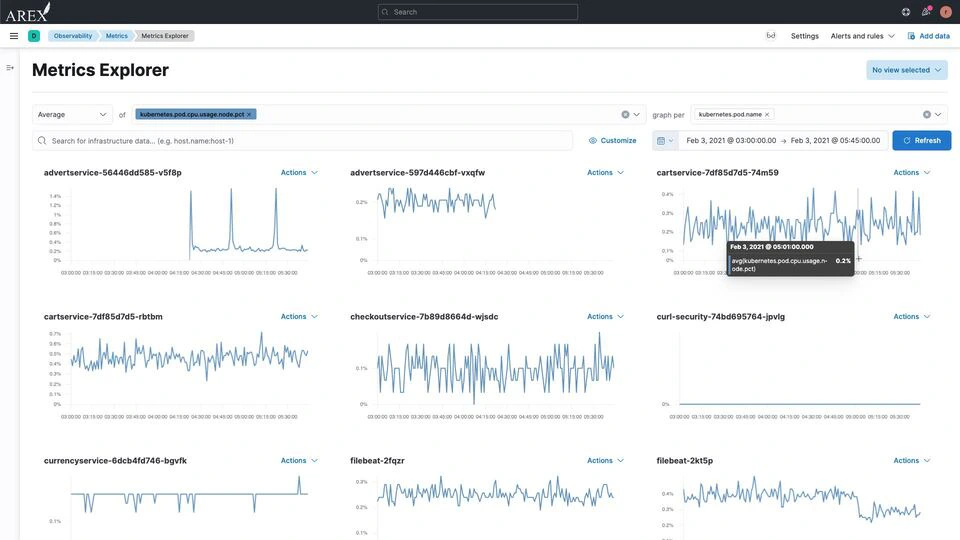
Use unlimited dimensionality and cardinality to explore all monitoring data in Arex’s powerful search platform for faster troubleshooting. Quickly explore attributes by host name, IP address, and tags. Customize your results and visualizations any way you like to help you investigate performance issues.Break down application and infrastructure silos for faster root cause detection
Enrich log entries with metadata that allows you to explore issues based on context. Identify meaningful trends in infrastructure data and correlate to other sources, such as logs and traces. Drive collaboration and increase team efficiency by accelerating time to problem resolution.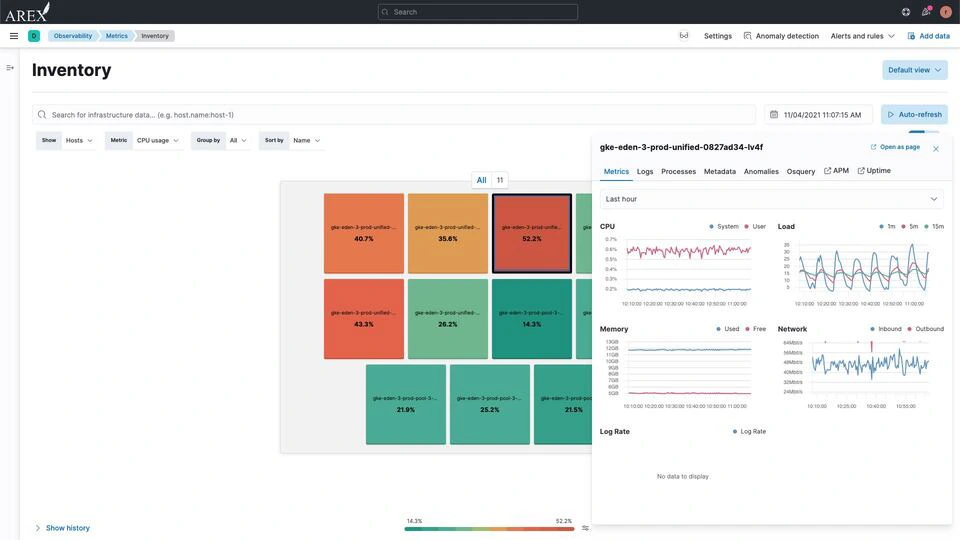
Showcase your service uptime with status page.
Communicate incidents and maintenances to your users within status pages and decent e-mails.
Seamlessly monitor your infrastructure with support for 200+ integrations, including cloud platforms such as AWS, Microsoft Azure, and Google Cloud. Efficiently store logs and metrics at high cardinality for faster troubleshooting with intuitive visualization and quick analysis supported by out of box machine learning and preconfigured dashboards.
Simplify infrastructure monitoring at scale
Unified Arex Agent with centralized management (Fleet) simplifies the collection and management of logs, metrics, and all other monitoring data. Deploy agents, update agent configurations, and add integrations for new data sources with a single click.Our customers bring search to life
From startups to the global 2000, Arex powers search solutions for thousands of companies worldwide to find documents, monitor infrastructure, protect against security threats, and more.Unparalleled visibility into all your infrastructure performance
Built on powerful Arexsearch, stream in and scale infrastructure metrics from your systems, cloud, network, and other infrastructure sources like AWS, Azure, GCP, Kafka, and NGINX through native Elastic integrations or common data shippers like Fluentd. Unify your infrastructure metrics from Prometheus with your logs, traces and end user monitoring data for complete end-to-end visibility.Pinpoint full-stack problems with advanced visualizations
Get logical and physical views of your infrastructure topology. Analyze current and historical performance trends for each infrastructure component with logs, processes, application performance, anomalies and metadata in context.Find the 'unknown unknowns'
Use unlimited dimensionality and cardinality to explore all monitoring data in Arex’s powerful search platform for faster troubleshooting. Quickly explore attributes by host name, IP address, and tags. Customize your results and visualizations any way you like to help you investigate performance issues.