Database Monitoring
is a vital activity for the maintenance of the performance and health of your database management system. To facilitate monitoring, the database management system collects information from the database manager, its databases, and any connected applications
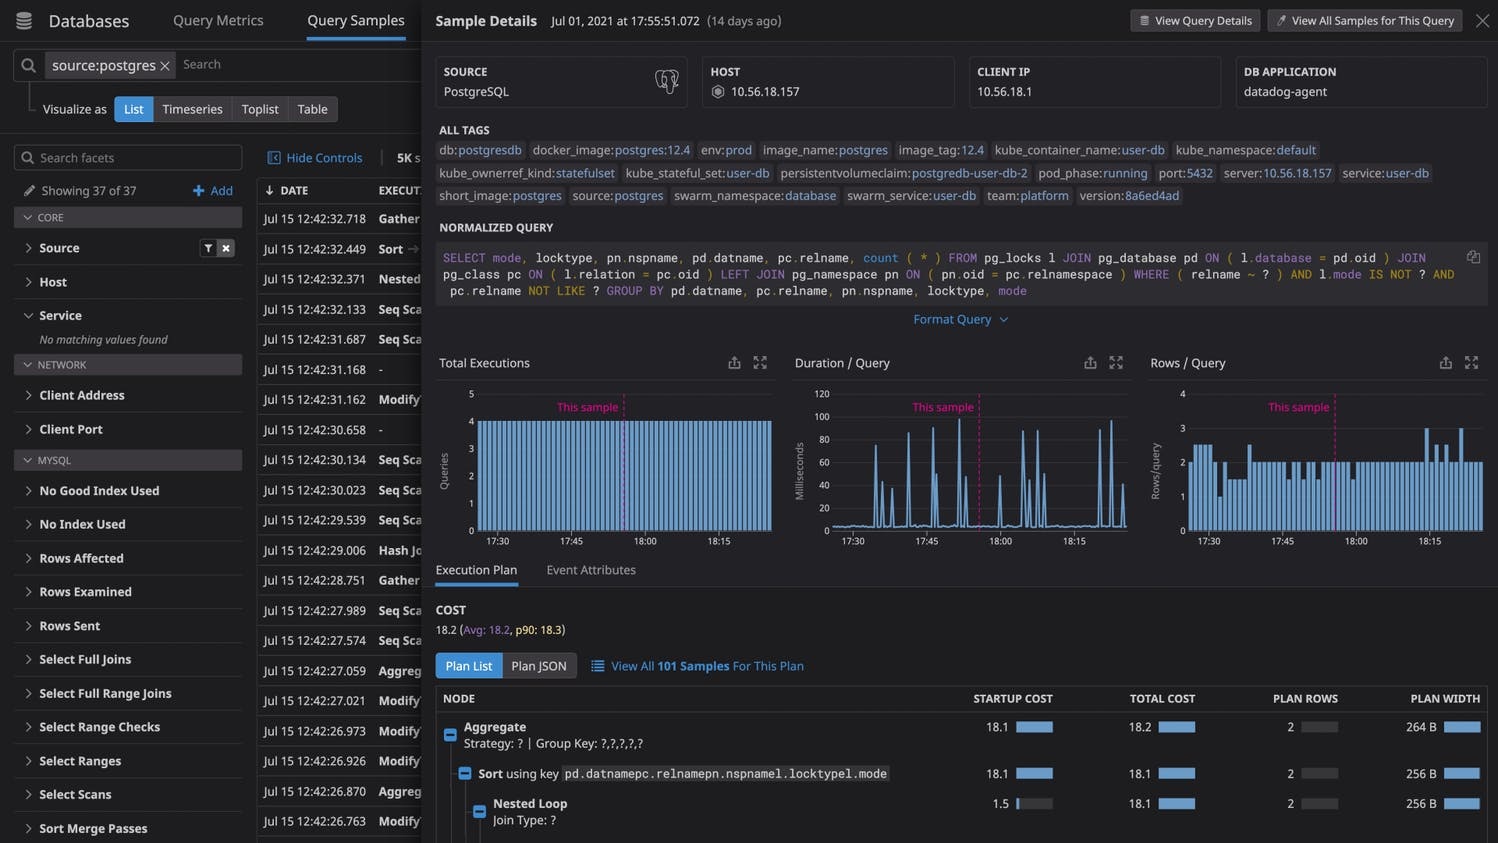
VALUABLE QUERY METRICS
Monitor your databases with query metrics
Identify problematic queries with valuable metrics such as average latency, total execution time, and number of rows queried
Leverage historical query performance data to track long-term trends
Get granular insight into query activity with automatically sampled queries
EXPLAIN PLAN ANALYSIS
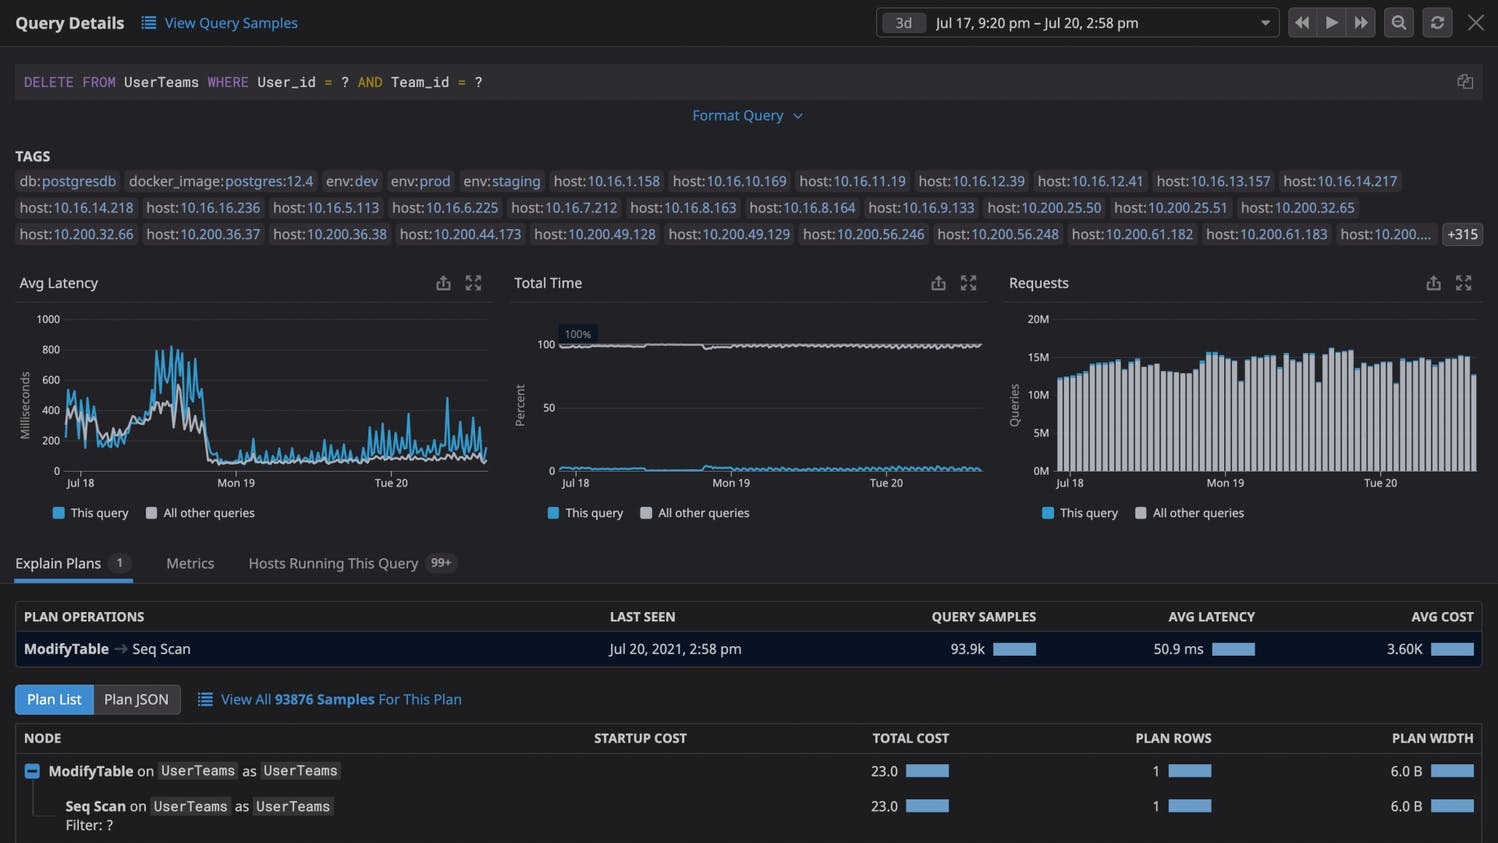
Analyze explain plans to optimize query performance
Dive into explain plans to identify inefficient query patterns that hinder performance
Visualize differences between multiple explain plans for individual queries in order to identify hotspots
Seamlessly pivot from explain plans to related metrics to understand how inefficiencies impact performance
UNIFIED PLATFORM
Correlate query metrics with database and infrastructure metrics
View query metrics alongside system performance metrics from your Postgres and MySQL databases
Monitor query-level and host-level metrics together to better understand how resource constraints affect database performance
Leverage out-of-the-box integration with the rest of the Arex platform, including dashboards, monitors, SLO tracking, and advanced formulas and functions
SECURE AND SCALABLE
without compromising database security
Expand your team’s access to query metrics without providing explicit database access to every user
Keep sensitive data secure with automatic obfuscation of PII in explain plans and query metrics
Scale DBM usage with your needs and manage a large number of databases securely
Showcase your service uptime with status page.
Communicate incidents and maintenances to your users within status pages and decent e-mails.
Identify problematic queries with valuable metrics such as average latency, total execution time, and number of rows queried
Leverage historical query performance data to track long-term trends
Get granular insight into query activity with automatically sampled queries
EXPLAIN PLAN ANALYSIS
Analyze explain plans to optimize query performance
Dive into explain plans to identify inefficient query patterns that hinder performance
Visualize differences between multiple explain plans for individual queries in order to identify hotspots
Seamlessly pivot from explain plans to related metrics to understand how inefficiencies impact performance
UNIFIED PLATFORM
Correlate query metrics with database and infrastructure metrics
View query metrics alongside system performance metrics from your Postgres and MySQL databases
Monitor query-level and host-level metrics together to better understand how resource constraints affect database performance
Leverage out-of-the-box integration with the rest of the Arex platform, including dashboards, monitors, SLO tracking, and advanced formulas and functions
SECURE AND SCALABLE
without compromising database security
Expand your team’s access to query metrics without providing explicit database access to every user
Keep sensitive data secure with automatic obfuscation of PII in explain plans and query metrics
Scale DBM usage with your needs and manage a large number of databases securely
Our customers bring search to life
From startups to the global 2000, Arex powers search solutions for thousands of companies worldwide to find documents, monitor infrastructure, protect against security threats, and more.
Slack
A cloud-based proprietary instant messaging platform developed by Slack Technologies.
Kik
A freeware instant messaging mobile app from the Canadian company Kik Interactive.
Feishu
Empowering teams by messenger, Meetings, calendar, docs, and emails. It's all in one place.